 COOL
COOL 


In this article
- 🔭 Why an LLM isn't observed like a database
- 📐 The GenAI semantic conventions, briefly
- 🏗️ What I'm building
- 🐳 Step 1 · Ollama and the Aspire dashboard in Docker
- ⬆️ Step 2 · Start the stack and check it
- 📦 Step 3 · The packages and the telemetry names
- 🏷️ Step 4 · One single place for the names
- 🔌 Step 5 · Register traces, metrics and logs
- 🧅 Step 6 · The IChatClient pipeline and the order that matters
- 🪆 The nesting, seen from outside
- 💰 Step 7 · The cost counter the library doesn't ship
- 🧮 The price list, kept out of the middleware
- 🚏 Step 8 · The Minimal API endpoints
- ▶️ Step 9 · The first request
- 📊 Step 10 · Reading the trace
- 📈 The three metrics worth watching
- 🔐 Prompts and completions in traces: when to say yes
- 🧪 Testing the telemetry contract
- ⚠️ The mistakes I made (and would make again)
- 📦 GitHub repo
- ✅ Final checklist
🔭 Why an LLM isn't observed like a database
For a SQL query the operational questions are two: how long did it take and did it fail? For a model call the questions become five: how long, how many tokens read, how many written, how many tool round-trips, and how much did it cost me. The infrastructure gives you the first two; the other three it does not.
There is a shape problem too. An HTTP request to an LLM with function calling is not a single call: it is a loop. The model answers by asking for a tool, your code runs it, sends the result back, the model answers again. Instrument only outbound HTTP and you see three unrelated spans and nothing that tells the story of the whole request.
HTTP instrumentation only
- Three POSTs to :11434, unrelated to each other
- No token counts: they live inside the body
- Executed tools show up nowhere
- Cost does not exist as data
gen_ai spans + metrics
- One parent span covering the whole loop
- Input and output tokens as attributes
- A child span for every tool execution
- A cost counter you can aggregate by model
The difference isn't the amount of data, it's that it becomes one story.
📐 The GenAI semantic conventions, briefly
OpenTelemetry has a specification dedicated to model calls: the semantic conventions for Generative AI. They define span names (chat, execute_tool, embeddings), required attributes and standard metrics. It is still marked experimental, but it is already what every backend — Aspire, Grafana, Application Insights, Datadog — expects to receive.
The practical benefit is portability: emit these names and the dashboard already knows how to group them without any configuration on your side. The version implemented by Microsoft.Extensions.AI 10.8 is v1.41 of the spec.
- Span
chat {model}: opens and closes around the whole conversation operation, not around a single HTTP call. - Attributes:
gen_ai.operation.name,gen_ai.provider.name,gen_ai.request.model,gen_ai.response.model. - Usage:
gen_ai.usage.input_tokensandgen_ai.usage.output_tokenson the span, plus thegen_ai.client.token.usagehistogram. - Latency: the
gen_ai.client.operation.durationhistogram, in seconds — that's where you read the p95. - Content: prompts and completions are optional and off by default, because they contain whatever the user typed.
span name       chat llama3.2:3b
duration        2.41s

gen_ai.operation.name        chat
gen_ai.provider.name         ollama
gen_ai.request.model         llama3.2:3b
gen_ai.response.model        llama3.2:3b
gen_ai.usage.input_tokens    412
gen_ai.usage.output_tokens   128

# added by the middleware I write further down
llmobs.usage.cost_usd        0.000139
OpenTelemetry · Semantic conventions for GenAI ↗
🏗️ What I'm building
A customer support API: a POST /chat endpoint that answers using a local model and a tool that reads the status of an order. Deliberately trivial as a feature, because the interesting part is everything around it.
The model runs on Ollama in Docker, telemetry leaves over OTLP towards the Aspire dashboard — a container as well, so nothing gets installed on the laptop except Docker. The API stays on the host, so I can rebuild it without rebuilding images.
- Runtime: .NET 10, Minimal API, no controllers.
- LLM abstraction: Microsoft.Extensions.AI with IChatClient and its middleware pipeline.
- Provider: OllamaSharp against llama3.2:3b locally.
- Telemetry: OpenTelemetry .NET for traces, metrics and logs, exported over OTLP/gRPC.
- Visualisation: the standalone Aspire dashboard, the official Microsoft container.
🐳 Step 1 · Ollama and the Aspire dashboard in Docker
The Aspire dashboard exists as a standalone image: an OTLP endpoint with a UI on top, and it needs no Aspire AppHost in your project. It serves the UI on 18888 and OTLP ingestion on 18889, which I publish on 4317 — the conventional port every SDK expects.
The ollama-init service is the trick that prevents a disappointing first request: as soon as Ollama passes its healthcheck, it pulls the model and exits. Without it, the first POST would hang for minutes while the container silently downloads two gigabytes.
services:
  ollama:
    image: ollama/ollama:latest
    ports: ["11434:11434"]
    volumes: [ollama-data:/root/.ollama]
    healthcheck:
      test: ["CMD-SHELL", "ollama list >/dev/null 2>&1 || exit 1"]
      interval: 10s
      retries: 12
      start_period: 20s

  # one-shot: pulls the model as soon as Ollama is healthy, then exits
  ollama-init:
    image: ollama/ollama:latest
    depends_on:
      ollama:
        condition: service_healthy
    environment:
      OLLAMA_HOST: http://ollama:11434
    entrypoint: ["/bin/sh", "-c", "ollama pull ${OLLAMA_MODEL:-llama3.2:3b}"]
    restart: "no"

  aspire-dashboard:
    image: mcr.microsoft.com/dotnet/aspire-dashboard:9.0
    ports:
      - "18888:18888"   # UI
      - "4317:18889"    # OTLP/gRPC
    environment:
      DOTNET_DASHBOARD_UNSECURED_ALLOW_ANONYMOUS: "true"
      ASPNETCORE_URLS: http://+:18888

volumes:
ollama-data:⬆️ Step 2 · Start the stack and check it
Three commands and the infrastructure is up. It is worth watching the ollama-init logs until success: until it appears the model isn't there yet, and every call would get a 404 from the Ollama server.
The DOTNET_DASHBOARD_UNSECURED_ALLOW_ANONYMOUS variable removes the dashboard login token. On a laptop that's convenience; on a shared machine it's a mistake, because that UI shows everybody's prompts.
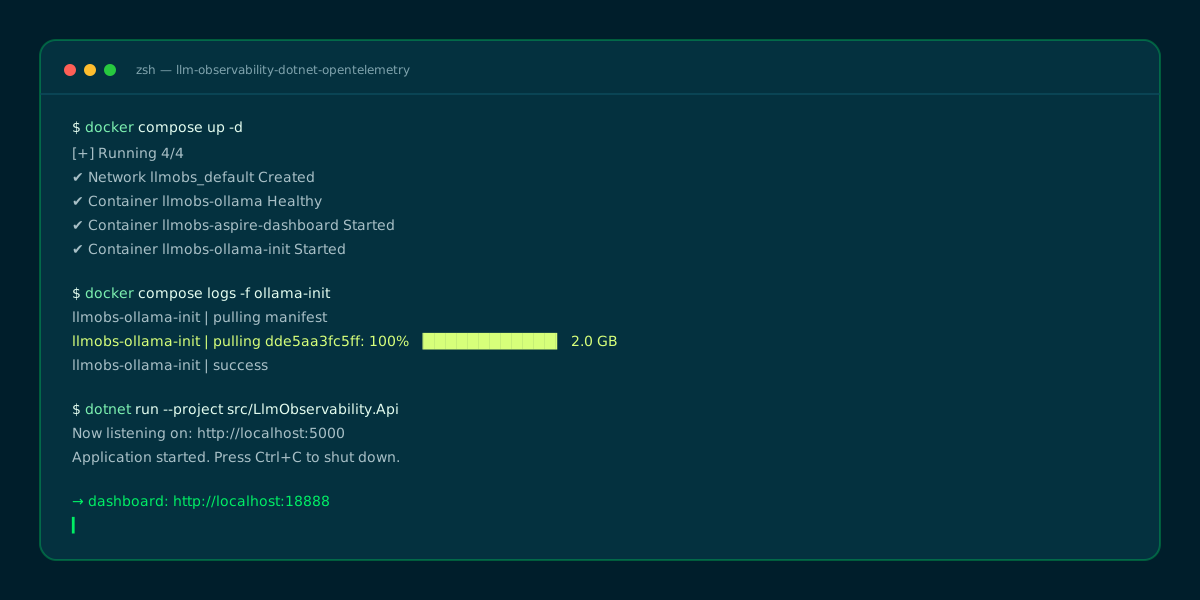
Wait for the ollama-init success before the first request.
📦 Step 3 · The packages and the telemetry names
Two families of packages: Microsoft.Extensions.AI with the OllamaSharp provider, and the OpenTelemetry SDK with the OTLP exporter and the ASP.NET Core, HttpClient and runtime instrumentations.
Then there is something that looks like pedantry and is instead the number one cause of empty dashboards: the source name. UseOpenTelemetry() takes a sourceName; if you don't pass one it uses an internal default, and if AddSource() says something else your spans exist but nobody is listening. I declare it once in a constants class and use it on both sides.
dotnet add package Microsoft.Extensions.AI
dotnet add package OllamaSharp

dotnet add package OpenTelemetry.Extensions.Hosting
dotnet add package OpenTelemetry.Exporter.OpenTelemetryProtocol
dotnet add package OpenTelemetry.Instrumentation.AspNetCore
dotnet add package OpenTelemetry.Instrumentation.Http
dotnet add package OpenTelemetry.Instrumentation.Runtime🏷️ Step 4 · One single place for the names
Three constants and the alignment problem disappears. I also register the library's default name: if some other pipeline in the app one day forgets the sourceName, telemetry keeps arriving instead of vanishing.
namespace LlmObservability.Api.Observability;

// Single source of truth for the names the app emits: this is what keeps
// UseOpenTelemetry() and AddSource()/AddMeter() in sync.
public static class TelemetryNames
{
    // ActivitySource + Meter passed explicitly to UseOpenTelemetry().
    public const string ChatSource = "LlmObservability.Ai";

    // Meter of the cost middleware (custom, outside the semantic conventions).
    public const string CostMeter = "LlmObservability.Cost";

    // ActivitySource of the app, for spans opened by hand.
    public const string AppSource = "LlmObservability.Api";

    // Name Microsoft.Extensions.AI uses when no sourceName is supplied.
    public const string LibraryDefaultSource = "Experimental.Microsoft.Extensions.AI";
}🔌 Step 5 · Register traces, metrics and logs
AddOpenTelemetry() builds the three pillars. The part that decides whether the dashboard will be useful or not is the service.name resource attribute: it is the field every backend groups by, and getting it wrong means finding everything under "unknown_service".
The ASP.NET Core and HttpClient instrumentations are not decoration: the first gives you the root span of the request, the second shows the actual call to Ollama underneath the gen_ai span. Without them the waterfall has a hole exactly where you need it.
Logs go through the same exporter, so a warning and the span that produced it share the trace id and the dashboard correlates them on its own.
// Registers the whole OpenTelemetry stack plus the objects the AI pipeline
// needs (price list, calculator, cost Meter).
public static IHostApplicationBuilder AddLlmObservability(this IHostApplicationBuilder builder)
{
    // 1) Price list and calculator, shared with the cost middleware.
    builder.Services.Configure<PricingOptions>(builder.Configuration.GetSection(PricingOptions.SectionName));
    builder.Services.AddSingleton(sp =>
        new CostCalculator(sp.GetRequiredService<IOptions<PricingOptions>>().Value));

    // 2) The Meter carrying the custom counter: singleton, stable name.
    builder.Services.AddSingleton(_ => new Meter(TelemetryNames.CostMeter));

    // 3) Who is emitting: service.name is the field everything groups by.
    var serviceName = builder.Configuration["Otel:ServiceName"] ?? "llm-observability-api";
    var otlpEndpoint = builder.Configuration["Otel:Endpoint"] ?? "http://localhost:4317";

    builder.Services.AddOpenTelemetry()
        .ConfigureResource(r => r.AddService(serviceName))
        .WithTracing(tracing => tracing
            .AddAspNetCoreInstrumentation()   // HTTP root span
            .AddHttpClientInstrumentation()   // the real call to Ollama
            .AddSource(TelemetryNames.ChatSource)
            .AddSource(TelemetryNames.LibraryDefaultSource)
            .AddSource(TelemetryNames.AppSource)
            .AddOtlpExporter(o => o.Endpoint = new Uri(otlpEndpoint)))
        .WithMetrics(metrics => metrics
            .AddAspNetCoreInstrumentation()
            .AddHttpClientInstrumentation()
            .AddRuntimeInstrumentation()
            .AddMeter(TelemetryNames.ChatSource)          // token/duration histograms
            .AddMeter(TelemetryNames.LibraryDefaultSource)
            .AddMeter(TelemetryNames.CostMeter)           // the cost counter
            .AddOtlpExporter(o => o.Endpoint = new Uri(otlpEndpoint)));

    // 4) Logs on the same pipe: warnings and spans correlated by trace id.
    builder.Logging.AddOpenTelemetry(logging =>
    {
        logging.IncludeFormattedMessage = true;
        logging.IncludeScopes = true;
        logging.AddOtlpExporter(o => o.Endpoint = new Uri(otlpEndpoint));
    });

    return builder;
}🧅 Step 6 · The IChatClient pipeline and the order that matters
ChatClientBuilder composes middleware the way ASP.NET Core does with the HTTP pipeline, but with a rule worth memorising: in Build() the factories are applied in reverse order, so the first one registered is the outermost.
The consequence is concrete. Put UseOpenTelemetry() last and it ends up inside the tool loop: the span measures a single iteration and the real latency of the request — the one your user suffers — appears in no chart at all. Register it first and the span wraps every function-calling round-trip.
Right inside it I put the client that computes cost, so its tags land on the span already opened by the layer above. Below that the tool loop, and finally the Ollama provider.
// ChatClientBuilder wraps in reverse registration order: the FIRST stage
// registered is the OUTERMOST. OpenTelemetry therefore measures the whole
// call, tool round-trips included, and the cost stage runs inside its span.
public static IHostApplicationBuilder AddInstrumentedChatClient(this IHostApplicationBuilder builder)
{
    builder.Services.Configure<OllamaOptions>(builder.Configuration.GetSection(OllamaOptions.SectionName));

    // Prompts and completions on spans: gold in development, a GDPR incident in production.
    var enableSensitiveData = builder.Configuration.GetValue("Otel:EnableSensitiveData", false);

    builder.Services.AddChatClient(sp =>
    {
        var options = sp.GetRequiredService<IOptions<OllamaOptions>>().Value;
        return new OllamaApiClient(new Uri(options.Endpoint), options.Model);
    })
        // Outermost: span and histograms cover everything below.
        .UseOpenTelemetry(
            sourceName: TelemetryNames.ChatSource,
            configure: c => c.EnableSensitiveData = enableSensitiveData)
        // Then cost, so its tags land on the span opened above.
        .Use((inner, sp) => new CostTrackingChatClient(
            inner,
            sp.GetRequiredService<CostCalculator>(),
            sp.GetRequiredService<Meter>(),
            sp.GetRequiredService<ILogger<CostTrackingChatClient>>()))
        // Innermost: the tool loop stays inside the span.
        .UseFunctionInvocation();

    return builder;
}🪆 The nesting, seen from outside
In one picture: four concentric layers, from the client that opens the span down to the provider talking HTTP with Ollama. It is the only diagram to keep in mind when adding a new middleware — caching, retry, rate limiting — because position decides what ends up inside the measurement and what stays out.
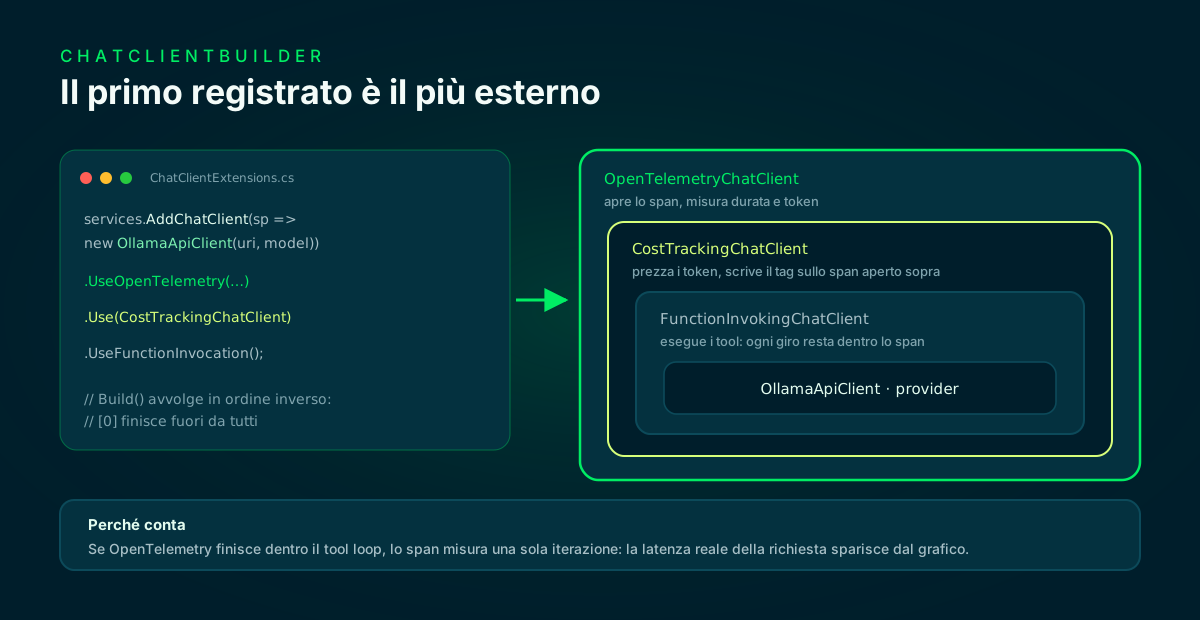
The first stage registered is the outermost: position decides what enters the measurement.
💰 Step 7 · The cost counter the library doesn't ship
Tokens and latency come from the library; cost does not, because it depends on your provider's price list. I add it with a DelegatingChatClient: it reads the response's UsageDetails, multiplies by the price, increments a counter and writes the value on the current span too.
The part I use most often is shadow pricing: the model answering is the local, free one, but the price list I value the tokens with is the cloud model I would use in production. The counter becomes an estimate of what the same traffic would cost after the migration, measured on real requests instead of a spreadsheet.
Watch out for streaming: there usage does not arrive in the response but inside a UsageContent on the last updates. Fail to accumulate it and half your traffic looks free.
// Stage that turns the tokens reported by the model into money. It sits INSIDE
// UseOpenTelemetry(), so its tags land on the gen_ai span already opened.
public sealed class CostTrackingChatClient : DelegatingChatClient
{
    private const string CostAttribute = "llmobs.usage.cost_usd";

    // Blocking call: delegate, then price whatever usage came back.
    public override async Task<ChatResponse> GetResponseAsync(
        IEnumerable<ChatMessage> messages,
        ChatOptions? options = null,
        CancellationToken cancellationToken = default)
    {
        var response = await base.GetResponseAsync(messages, options, cancellationToken);
        Record(response.ModelId, response.Usage);
        return response;
    }

    // When streaming, usage arrives as UsageContent inside the updates:
    // accumulate and price once, when the stream ends.
    public override async IAsyncEnumerable<ChatResponseUpdate> GetStreamingResponseAsync(
        IEnumerable<ChatMessage> messages,
        ChatOptions? options = null,
        [EnumeratorCancellation] CancellationToken cancellationToken = default)
    {
        var totals = new UsageDetails();
        string? modelId = null;

        await foreach (var update in base.GetStreamingResponseAsync(messages, options, cancellationToken))
        {
            modelId ??= update.ModelId;
            var usages = update.Contents.OfType<UsageContent>().Select(c => c.Details);
            usages.ToList().ForEach(totals.Add);
            yield return update;
        }

        Record(modelId, totals);
    }

    // Computes the cost, records it on the counter and tags the current span.
    private void Record(string? modelId, UsageDetails? usage)
    {
        // 1) Guard: some providers omit usage entirely — nothing to price.
        if (usage is null)
            return;

        var model = modelId ?? "unknown";
        var input = usage.InputTokenCount ?? 0;
        var output = usage.OutputTokenCount ?? 0;

        // 2) Which price list values these tokens (shadow pricing).
        var billingModel = _calculator.ResolveBillingModel(model);
        var cost = _calculator.Estimate(billingModel, input, output);

        // 3) A chart flat at zero is a configuration bug far more often than good news.
        if (cost == 0m && (input > 0 || output > 0))
            _logger.LogWarning("No price list entry for model {BillingModel}: cost reported as 0.", billingModel);

        // 4) Counter with the tags you will group by in the dashboard.
        _costCounter.Add((double)cost,
            new KeyValuePair<string, object?>("gen_ai.request.model", model),
            new KeyValuePair<string, object?>("llmobs.billing.model", billingModel));

        // 5) Same number on the span: a slow request also tells you what it cost.
        Activity.Current?.SetTag(CostAttribute, (double)cost);
    }
}🧮 The price list, kept out of the middleware
I isolate the pricing maths in a pure class: no dependencies, no Activity, no Meter. It is the part you test in two lines and that I don't want to re-verify every time I touch the instrumentation.
An empty BillingModel means "value with the price list of the model that answered"; set it and shadow pricing kicks in. A model missing from the list costs zero and raises no exception: the metric stays valid, it just says it's free.
// Turns a token count into a monetary estimate using the configured price list.
// Pure and dependency-free on purpose: this is the piece worth unit-testing.
public sealed class CostCalculator(PricingOptions pricing)
{
    // Model whose price list values the tokens: the configured billing model
    // when set (shadow pricing), otherwise the model that answered.
    public string ResolveBillingModel(string responseModel)
    {
        if (!string.IsNullOrWhiteSpace(pricing.BillingModel))
            return pricing.BillingModel;
        return responseModel;
    }

    // Cost in USD of an input/output token pair for the given model.
    // Returns 0 when the model is not in the price list: typical for a local model.
    public decimal Estimate(string model, long inputTokens, long outputTokens)
    {
        // 1) Guard: an unknown model has no price, so no cost to report.
        if (!pricing.Models.TryGetValue(model, out var price))
            return 0m;

        // 2) Prices are per million tokens, so scale both sides down.
        var input = inputTokens / 1_000_000m * price.InputPerMillionUsd;
        var output = outputTokens / 1_000_000m * price.OutputPerMillionUsd;
        return input + output;
    }
}🚏 Step 8 · The Minimal API endpoints
Two routes: one blocking, one streaming over SSE. In the blocking response I also return the trace id, because that is the gesture that makes observability actually usable: paste that id into the dashboard and you are on the exact request the user is complaining about, without hunting by timestamp.
The GetOrderStatus tool isn't there for the feature, it's there for the trace: every execution becomes a child span, and that is how you find out the bottleneck wasn't the model but the query behind the tool.
// Blocking call: returns the numbers that also land in the dashboard,
// plus the trace id to look the request up by.
private static async Task<IResult> HandleChatAsync(
    ChatRequest request,
    IChatClient chatClient,
    CostCalculator calculator,
    IOptions<PricingOptions> pricing,
    CancellationToken cancellationToken)
{
    // 1) Guard: an empty prompt is a client bug, not a model problem.
    if (string.IsNullOrWhiteSpace(request.Prompt))
        return TypedResults.BadRequest(new ErrorResponse("Prompt must not be empty."));

    // 2) Ask the model, letting the pipeline handle tools and telemetry.
    var messages = BuildMessages(request.Prompt);
    var response = await chatClient.GetResponseAsync(
        messages,
        new ChatOptions { Tools = SupportTools.BuildTools() },
        cancellationToken);

    // 3) Re-derive the same cost the middleware recorded, to expose it.
    var model = response.ModelId ?? "unknown";
    var input = response.Usage?.InputTokenCount ?? 0;
    var output = response.Usage?.OutputTokenCount ?? 0;
    var cost = calculator.Estimate(calculator.ResolveBillingModel(model), input, output);

    return TypedResults.Ok(new ChatReply(
        response.Text,
        model,
        input,
        output,
        cost,
        Activity.Current?.TraceId.ToString() ?? string.Empty));
}▶️ Step 9 · The first request
With the stack up and the API running, one curl closes the loop. The response carries model, tokens, estimated cost and trace id: four numbers that did not exist anywhere before.
Cost here is computed with the gpt-4o-mini price list even though llama3.2:3b answered — 383 input tokens and 75 output tokens make 0.000102 dollars. On one request that's noise; on a hundred thousand it's the number that decides whether moving to the cloud makes sense.
curl -s http://localhost:5173/chat \
  -H 'content-type: application/json' \
  -d '{"prompt":"What is the status of order A-1001?"}'

{
  "text": "Order A-1001 has shipped, delivery expected on 12 August 2026 with BRT.",
  "model": "llama3.2:3b",
  "inputTokens": 383,
  "outputTokens": 75,
  "estimatedCostUsd": 0.00010245,
  "traceId": "d6b5f062116d0af3fc41d7ac617dc81a"
}📊 Step 10 · Reading the trace
In the dashboard, under Traces, the request shows up as a four-level waterfall: the HTTP span, the chat llama3.2:3b span, the first model call, the tool execution and the second model call once the tool answered.
This is where questions turn into answers: two model calls for a single request explain the two and a half seconds, and the tool with its twelve milliseconds is immediately off the suspect list.
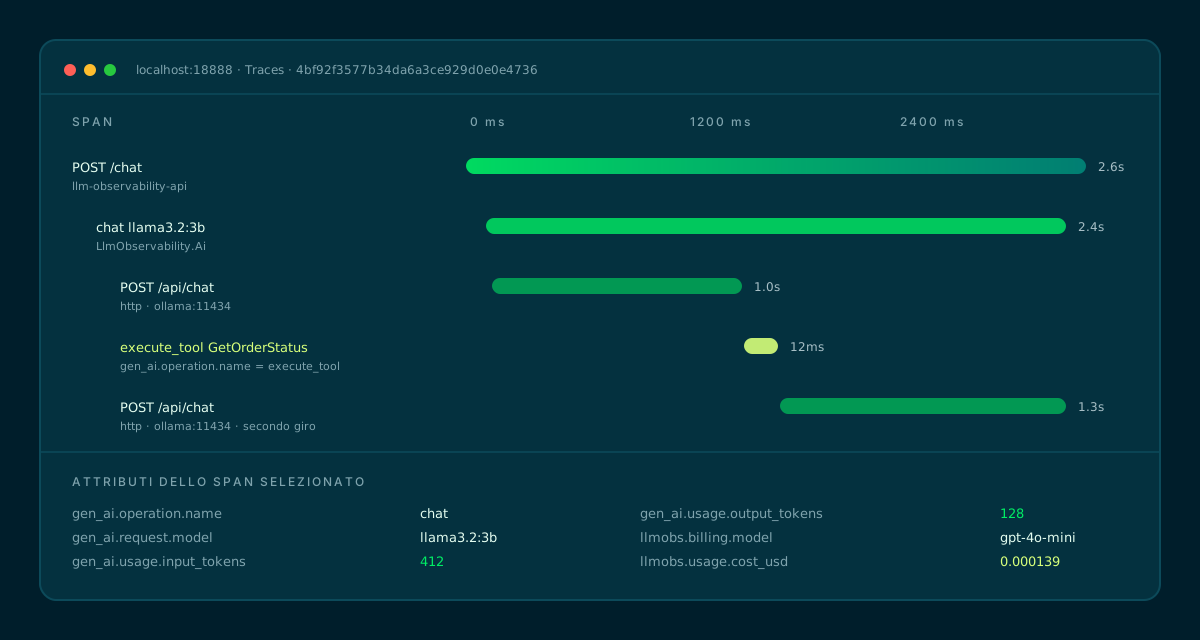
Two model round-trips, a 12 ms tool: the time is all in generation.
📈 The three metrics worth watching
Under Metrics you find the histograms emitted by the library plus the counter I added. You don't need twenty panels: three are enough, and each answers a different question.
- gen_ai.client.token.usage: how much context you are burning. A sudden jump almost always means a prompt that grew or a history that was never pruned.
- gen_ai.client.operation.duration: look at the p95, not the average. LLM latency has a long tail and the mean hides it.
- gen_ai.client.cost.usd: the total, groupable by model. With shadow pricing it is a cloud spend estimate computed on real traffic.
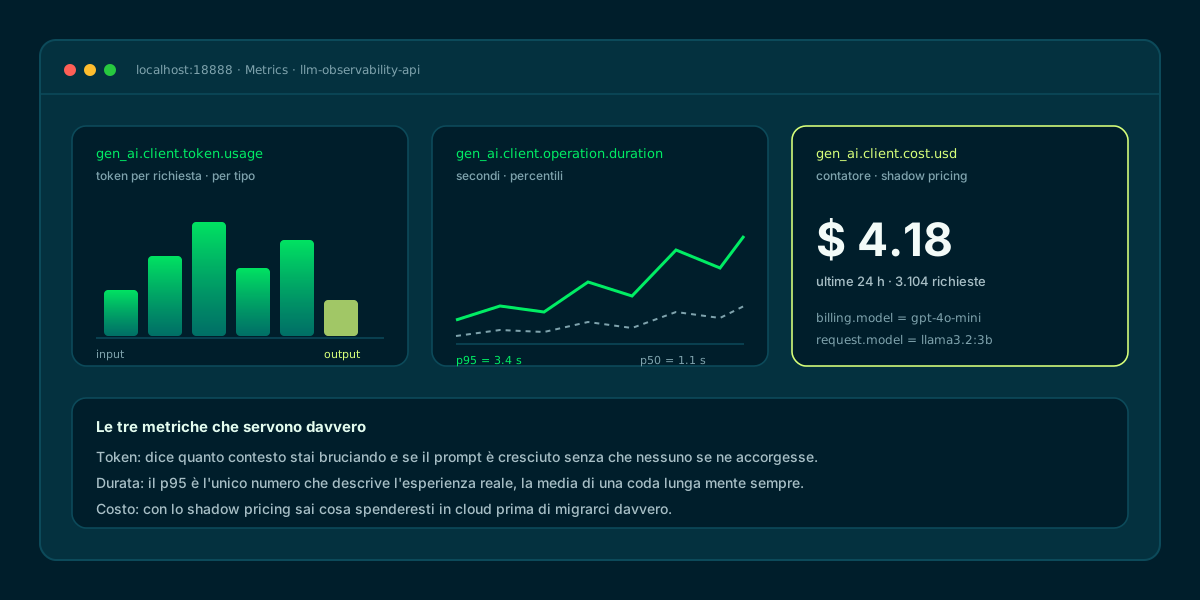
Three panels, three different questions: context, user experience, spend.
🔐 Prompts and completions in traces: when to say yes
EnableSensitiveData puts the text of messages and responses on the spans. In development it is priceless — you see exactly what reached the model — but in production it means copying everything the user typed into a telemetry system, with everything that implies for personal data and retention.
My rule is simple: on locally through appsettings.Development.json, off everywhere else. If production genuinely needs a sample, an explicit sampling on a small share of requests beats a global switch.
{
  "Ollama": {
    "Endpoint": "http://localhost:11434",
    "Model": "llama3.2:3b"
  },
  "Otel": {
    "ServiceName": "llm-observability-api",
    "Endpoint": "http://localhost:4317",
    "EnableSensitiveData": true
  },
  "Pricing": {
    "BillingModel": "gpt-4o-mini",
    "Models": {
      "gpt-4o-mini": { "InputPerMillionUsd": 0.15, "OutputPerMillionUsd": 0.60 }
    }
  }
}🧪 Testing the telemetry contract
Instrumentation has a cruel flaw: when it breaks it throws no exception, it simply stops producing data. An update that renames a source or changes an attribute gets discovered weeks later, in front of an empty chart.
That is why I treat telemetry names as a contract and verify them with tests: an ActivityListener on the source the app registers, a MeterListener on the cost counter. No model, no network — a fake provider declaring a known usage and nothing more.
[Fact]
public async Task Pipeline_EmitsAGenAiSpanOnTheConfiguredSource()
{
    // 1) Listen only to the source name the app registers with AddSource().
    var captured = new List<Activity>();
    using var listener = new ActivityListener
    {
        ShouldListenTo = source => source.Name == TelemetryNames.ChatSource,
        Sample = (ref ActivityCreationOptions<ActivityContext> _) => ActivitySamplingResult.AllDataAndRecorded,
        ActivityStopped = captured.Add,
    };
    ActivitySource.AddActivityListener(listener);

    // 2) One call through the pipeline, over a fake provider.
    var (client, meter) = BuildPipeline(billingModel: "gpt-4o-mini");
    using var _ = meter;
    await client.GetResponseAsync("hello");

    // 3) The span must exist and carry the semantic-convention attributes.
    var span = Assert.Single(captured);
    Assert.Contains("gen_ai.usage.input_tokens", span.TagObjects.Select(t => t.Key));
    Assert.Contains("gen_ai.usage.output_tokens", span.TagObjects.Select(t => t.Key));

    // 4) …and my middleware's tag: proof the cost stage runs INSIDE the span.
    Assert.Contains("llmobs.usage.cost_usd", span.TagObjects.Select(t => t.Key));
}⚠️ The mistakes I made (and would make again)
Four traps no error message will point out to you, because the outcome is always the same: the dashboard looks like it works and simply shows nothing useful.
- Mismatched source name:
UseOpenTelemetry()without asourceNameandAddSource()with a made-up one. The spans exist, nobody listens. - OpenTelemetry registered last: it ends up inside the tool loop and the span measures a single round-trip. Real latency disappears.
- Streaming left unpriced: usage arrives in a
UsageContenton the last updates, not in the response. Don't accumulate it and half your traffic looks free. - service.name forgotten: everything lands under "unknown_service" and the charts of two different services silently add up.
📦 GitHub repo
All the code in this article — the instrumented Minimal API, the cost middleware, the telemetry contract tests and a docker-compose.yml with Ollama, the model pull and the Aspire dashboard — lives in the public repo fscamuzzi/llm-observability-dotnet-opentelemetry. Clone it, docker compose up -d, dotnet run and in a few minutes you have traces in front of you.
The README has the prerequisites, the technology table, what to look at in the dashboard and the cleanup commands. Every snippet in this article is taken verbatim from that repo, which actually runs: the seven tests pass and the sample first request is the one I ran while writing the article.
git clone https://github.com/fscamuzzi/llm-observability-dotnet-opentelemetry
cd llm-observability-dotnet-opentelemetry

docker compose up -d
docker compose logs -f ollama-init   # wait for 'success'

dotnet test
dotnet run --project src/LlmObservability.Api
GitHub repo · llm-observability-dotnet-opentelemetry ↗
✅ Final checklist
Before I consider an app that calls an LLM instrumented, these are the points I check one by one.
- An explicit
sourceNameinUseOpenTelemetry()and the same constant inAddSource()andAddMeter()? UseOpenTelemetry()registered first, therefore outside the tool loop?service.nameset to the real name of the service?- ASP.NET Core and HttpClient instrumentation on, so you get the root span and the provider call?
- Cost priced on streaming calls too?
EnableSensitiveDataoff outside development?- A test that fails when a telemetry name changes?
Frequently asked questions about LLM observability .NET
Do I need .NET Aspire to use the Aspire dashboard?
No. The dashboard ships as a standalone Docker image (mcr.microsoft.com/dotnet/aspire-dashboard) and is effectively an OTLP endpoint with a UI on top. No AppHost, no Aspire package in your project: your app just has to export over OTLP. That holds for non-.NET apps too.
Can I use Grafana or Application Insights instead of the Aspire dashboard?
Yes, and that is the whole point of the semantic conventions. The app exports over standard OTLP: change the endpoint and telemetry goes to an OpenTelemetry Collector, Grafana Tempo, Application Insights or Datadog without touching a line of application code. I use the Aspire dashboard in development because it is one container and zero configuration.
Why do tokens appear on the span but cost doesn't?
Because cost is not a property of the call, it is a property of your commercial contract: the same answer costs different amounts depending on provider and plan. The semantic conventions stop at tokens; converting to money is on you, and that is exactly what the CostTrackingChatClient in this article does.
Does instrumentation slow down model calls?
Negligibly compared to generation. A span and a handful of attributes are measured in microseconds against seconds of inference. The only real cost is OTLP export, which is asynchronous and batched anyway. The genuine risk is volume, not latency: with EnableSensitiveData on you are shipping whole prompts on every request.
What changes with a cloud provider instead of Ollama?
Nothing in the instrumentation: you only swap the innermost layer of the pipeline, replacing OllamaApiClient with the OpenAI or Azure OpenAI client. Spans, attributes, histograms and the cost counter stay identical because they work on the IChatClient abstraction. With a paid model, shadow pricing simply becomes pricing.
Let's talk
If this topic is relevant to you, write to me: comparing notes on code and AI is always time well spent.


